Running an EV detection
Last updated: August 24, 2026
Scan your meter fleet for likely EV charging and get back a ranked list of candidates to review.
EV Detection scores every meter in a date range for how much its load looks like EV charging, then hands you the ones worth reviewing. You don't need a submeter, a connected charger, or an enrollment list, just interval meter data.
This article walks through setting up a run. Reviewing the results is covered in Reviewing EV detection candidates.
Start a run
Open DER Detection. From the left navigation under Insights --> DER Detection
Select Start a Run. This opens the run configuration.
Set your detection window. Pick the start and end dates of meter data to scan. Aim for at least eight weeks — the model leans heavily on charging recurring across many days, and a short window makes a real EV look like a one-off load.
Check the time zone. Set it to the time zone of the territory you're scanning. The model weighs overnight charging heavily, so a run that's off by a few hours will quietly return worse results.
Set maximum peak demand if you need to. This caps the sustained peak load the model will still treat as residential charging. Raise it if you expect multiple vehicles behind a single meter; leave the default if you're looking for typical single-vehicle homes.
Run it. Weather for the territory is pulled in automatically — it's how the model discounts air conditioning and heating. When the run finishes, your candidates appear in the list.
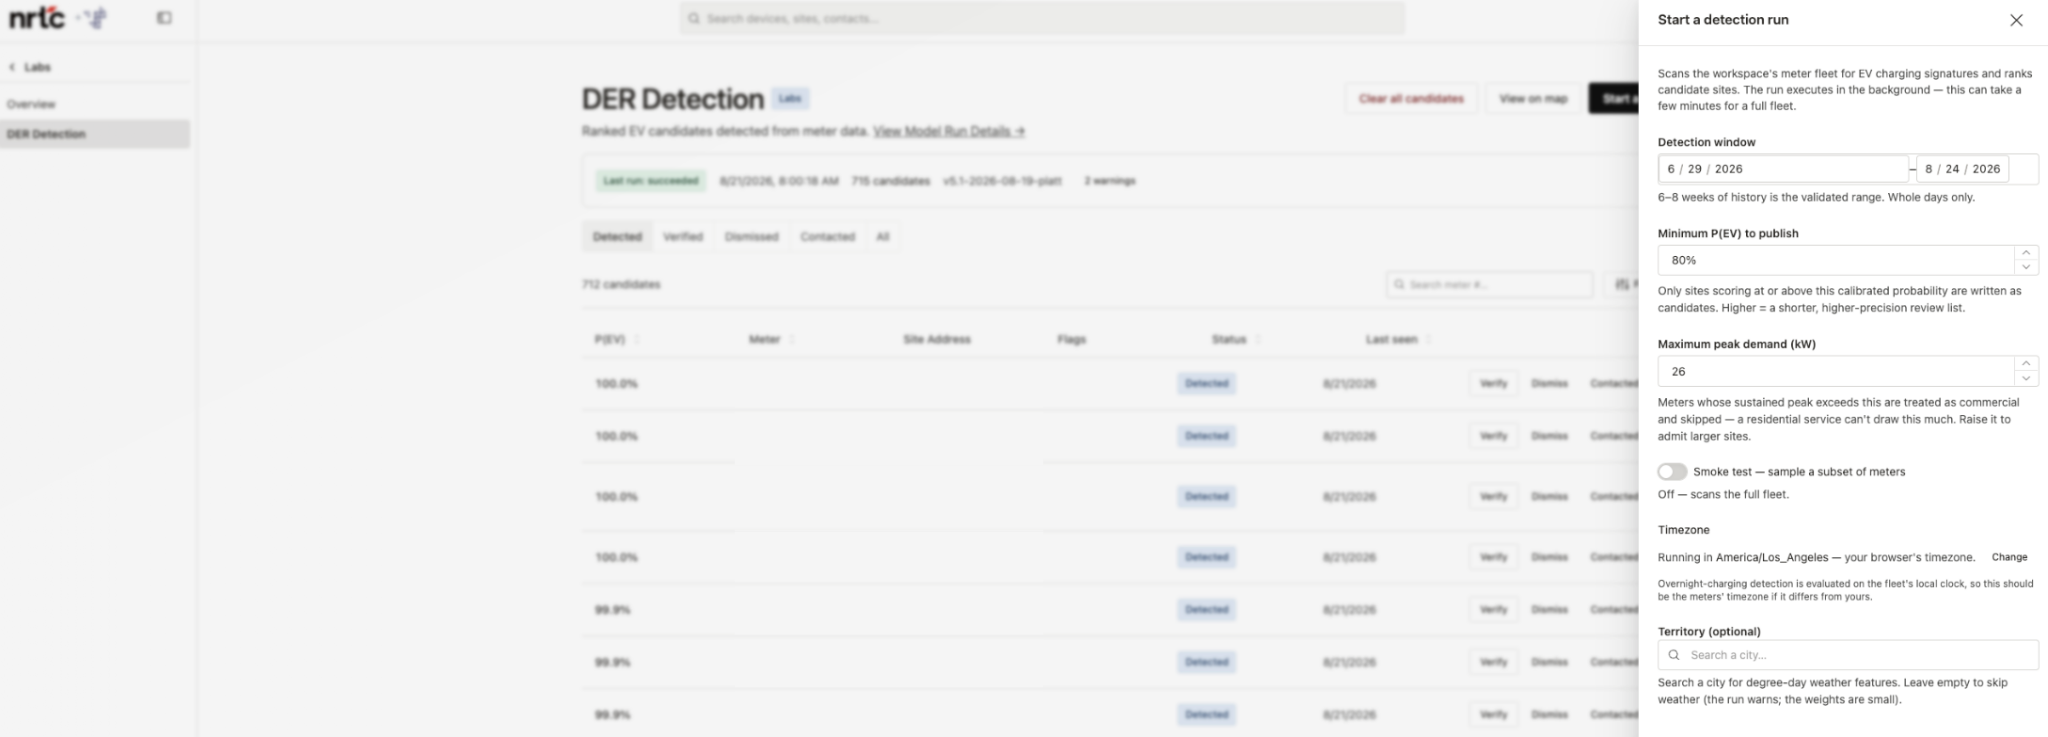
Candidates are written to your list at 80% confidence and above. That floor is set to keep the list precision-first rather than thousands of maybes.
What you get back
Each candidate is one meter, with:
A confidence score from 80% to 100%. The number is calibrated, so 80% really does mean about 80%.
Load curves: the specific charging sessions the model keyed on, so you can judge the shape yourself rather than trusting a number.
Flags where they apply: plain-language notes like threshold_hugging or net_metered that mean "look closer," not "reject."
Links to the site, device, and map so you can see the address, the meter, and where the candidate sits on your system.
Run it again
Runs aren't one-and-done. You can run detection daily, weekly, or whenever new data lands. Candidates persist between runs until you act on them, so nothing you've already reviewed gets reset. Once your meter data is streaming continuously, a recurring run is the natural way to catch new EV adoption as it happens.
If you want to narrow a repeat run's output, filter the list by last seen to focus on what's newly detected rather than re-reading candidates you've already worked.
Good to know
Coarser intervals still work. 15-minute or 30-minute data is ideal; hourly data runs, but blurs the edges of a session slightly.
Reactive energy helps. Where your meters report kVARh, the model gets a power-factor clue that cleanly separates motors — pool pumps, AC — from charging.
Partial data understates results. If a block of meters only starts reporting partway through your window, those meters have less recurrence to show and will score lower. Check your data coverage before concluding a territory has few EVs.
This is residential detection. Commercial and industrial load profiles are deliberately filtered out.
Season matters. A summer window carries summer confounders and a winter window carries winter ones. Your first run isn't a permanent calibration of your fleet.
Reviewing helps the next run. Your verify and dismiss decisions become labeled examples that sharpen the model on your own system. Only the load signature and your label are used — no customer PII.
Related articles
Reviewing EV detection candidates: working through the list and the map.
EV Detection (platform docs): how the two-stage detector works and what each flag tests.
Meters: what AMI data Texture ingests and at what cadence.