Reviewing EV detection candidates
Last updated: August 24, 2026
Confirm or rule out detected EVs against the actual load curves, from the list or the map.
A detection run gives you candidates, not conclusions. Each one comes with the charging sessions the model used to order the list, so you can look at the curve and decide for yourself.
This article covers working the list, reading the flags, and reviewing from the map. Setting up a run is covered in Running an EV detection.
Review from the candidate list
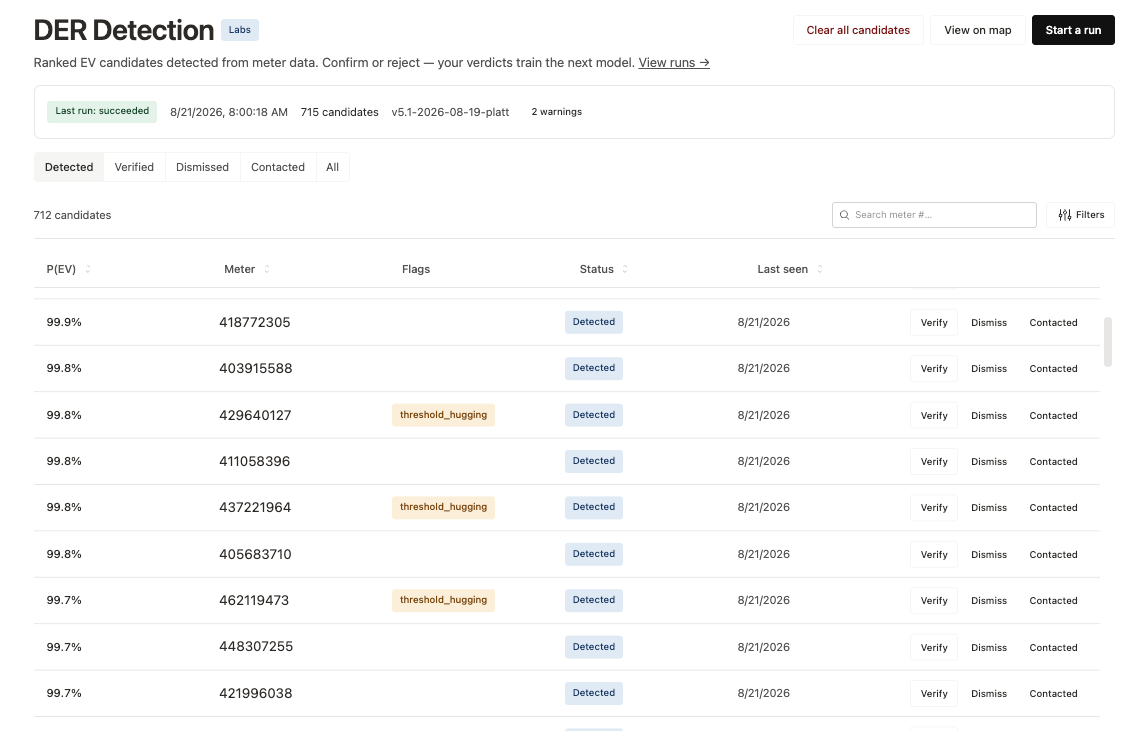
Open DER Detection. Your candidates are ranked by confidence, highest first. Start at the top. Those are both the most likely to confirm and the fastest to judge.
Narrow the list. Filter by probability, by flag, or by when a candidate was last seen. You can also search by meter number or service address to jump straight to a specific meter.
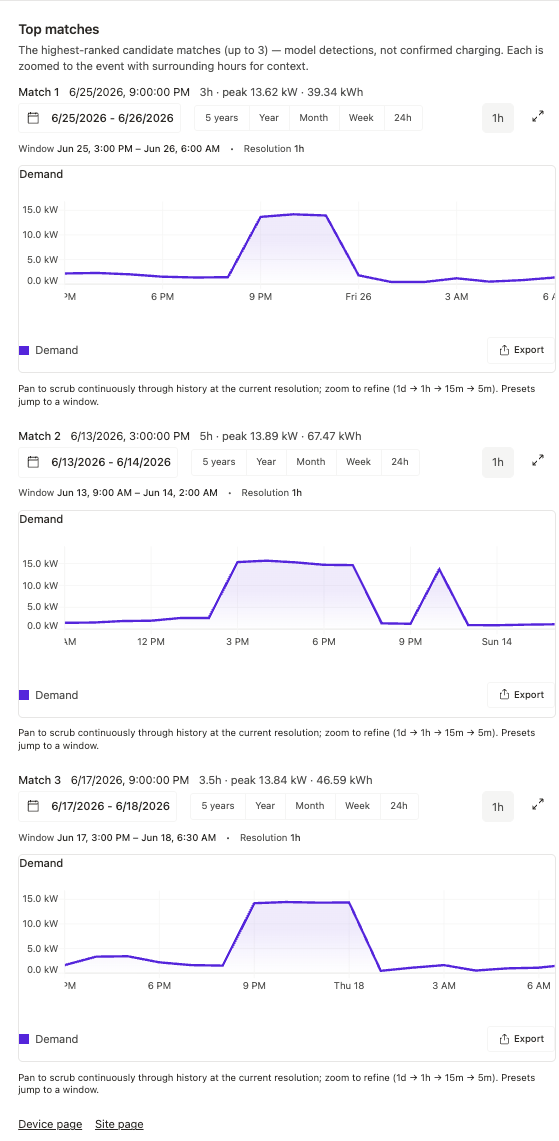
Click a candidate. You'll land on the top load curves the model selected. A convincing EV looks like a flat-topped block of added load: Sharp edges, a steady draw of roughly 3.3–7 kW, held for a few hours, usually overnight, showing up on several different days.
Scroll the surrounding days. Seeing what the home's baseline looks like on non-charging days tells you whether that block is genuinely added load or just how this house behaves.
Check the site if you need more context. The candidate links through to the site page and the device page.
Make the call. Verify, dismiss, or mark as contacted if you've reached out to the member.
To see candidates you've already actioned, switch to the All tab — it shows every candidate regardless of state. Verifying isn't permanent either; you can unverify a candidate if you change your mind.
Review from the map
The map is the better surface when you care about where EVs are clustering — a new subdivision, a single street, or a stretch of feeder.
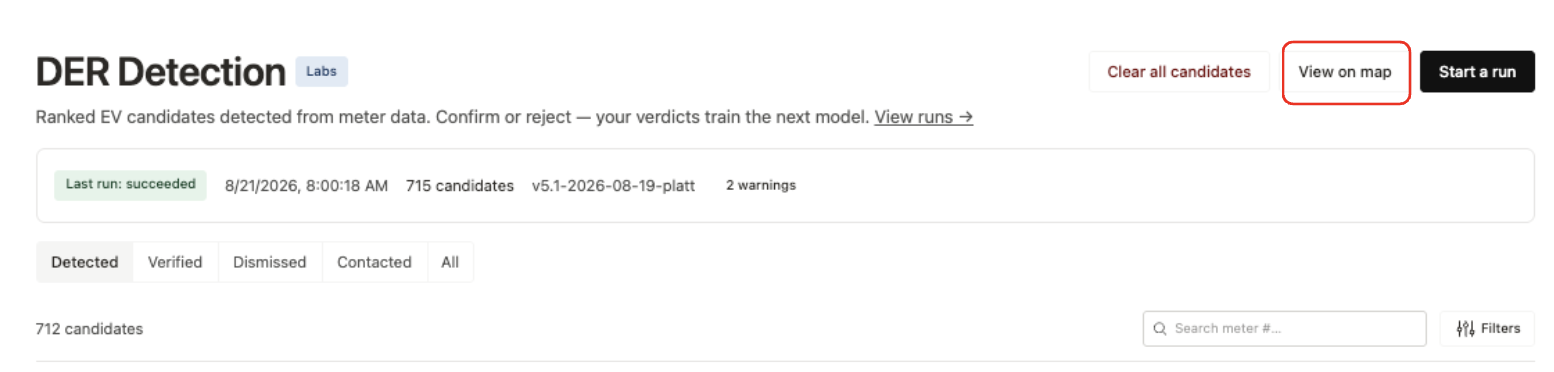
Select View on map from the candidate list. Your candidates appear as a dedicated EV layer.
Turn off the sites and devices layers. With everything on at once the map gets noisy; hiding the other layers makes the EV clusters obvious.
Apply your filters. The same probability and flag filters from the list work on the map, so you can show only your highest-confidence candidates, or only unflagged ones.
Hover a marker to see the meter number, the confidence, and when it was detected.
Click a marker to pull up the same load curves, and verify, dismiss, or mark as contacted right there in map context.
Markers are color and icon coded by state as you work, so the map doubles as a progress view. Verified candidates turn green, contacted ones pick up a phone icon, and dismissed candidates drop off the layer.
Reading the flags
A flag means verify first, not that a candidate is wrong. Flags are computed from fixed rules and don't change the confidence score; they're attached alongside it to tell you where to look harder.
threshold_hugging: the charging power sits in the band where a water heater, pool pump, or well pump looks much the same. This is the most common flag by a wide margin. Lean on session size and overnight recurrence to break the tie.
continuous_load_like: sessions run long enough to read as equipment rather than a vehicle, like a welder or kiln. Worth checking whether the site is a workshop or hobbyist setup.
low_recurrence: too few distinct charging days to establish a habit. Could be a real EV that travels, or a one-off load.
possible_new_adoption: charging only appears in the second half of the window, consistent with a vehicle bought partway through. The earlier absence isn't evidence against.
net_metered: there's solar export on site, so generation masks daylight consumption. Trust the overnight sessions here, not the midday signal.
known_der_site: the site already has a connected DER on Texture. The detection may well be right, it's just not news, and probably not an outreach target.
Good to know
Candidates persist across runs. They stay on your list until you verify, dismiss, or mark them contacted. A recurring run won't reset work in progress.
Your decisions train the model. Verified and dismissed candidates become labeled examples of what charging does and doesn't look like on your system, which sharpens later runs. Only the load signature and your label are used; no customer PII.
The score is calibrated. 80% means roughly 80% likelihood, so you can compare candidates by number without second-guessing the scale.
Related articles