Viewing and Filtering Transformer Loading
Last updated: August 26, 2026
Transformer loading shows how hard a distribution transformer is working, estimated from the meters downstream of it. You can look at a single transformer's load over time, or open a fleet-wide table to sort and filter across every transformer you have.
Find a single transformer's load
Open Explore. From the left navigation, go to Explore.
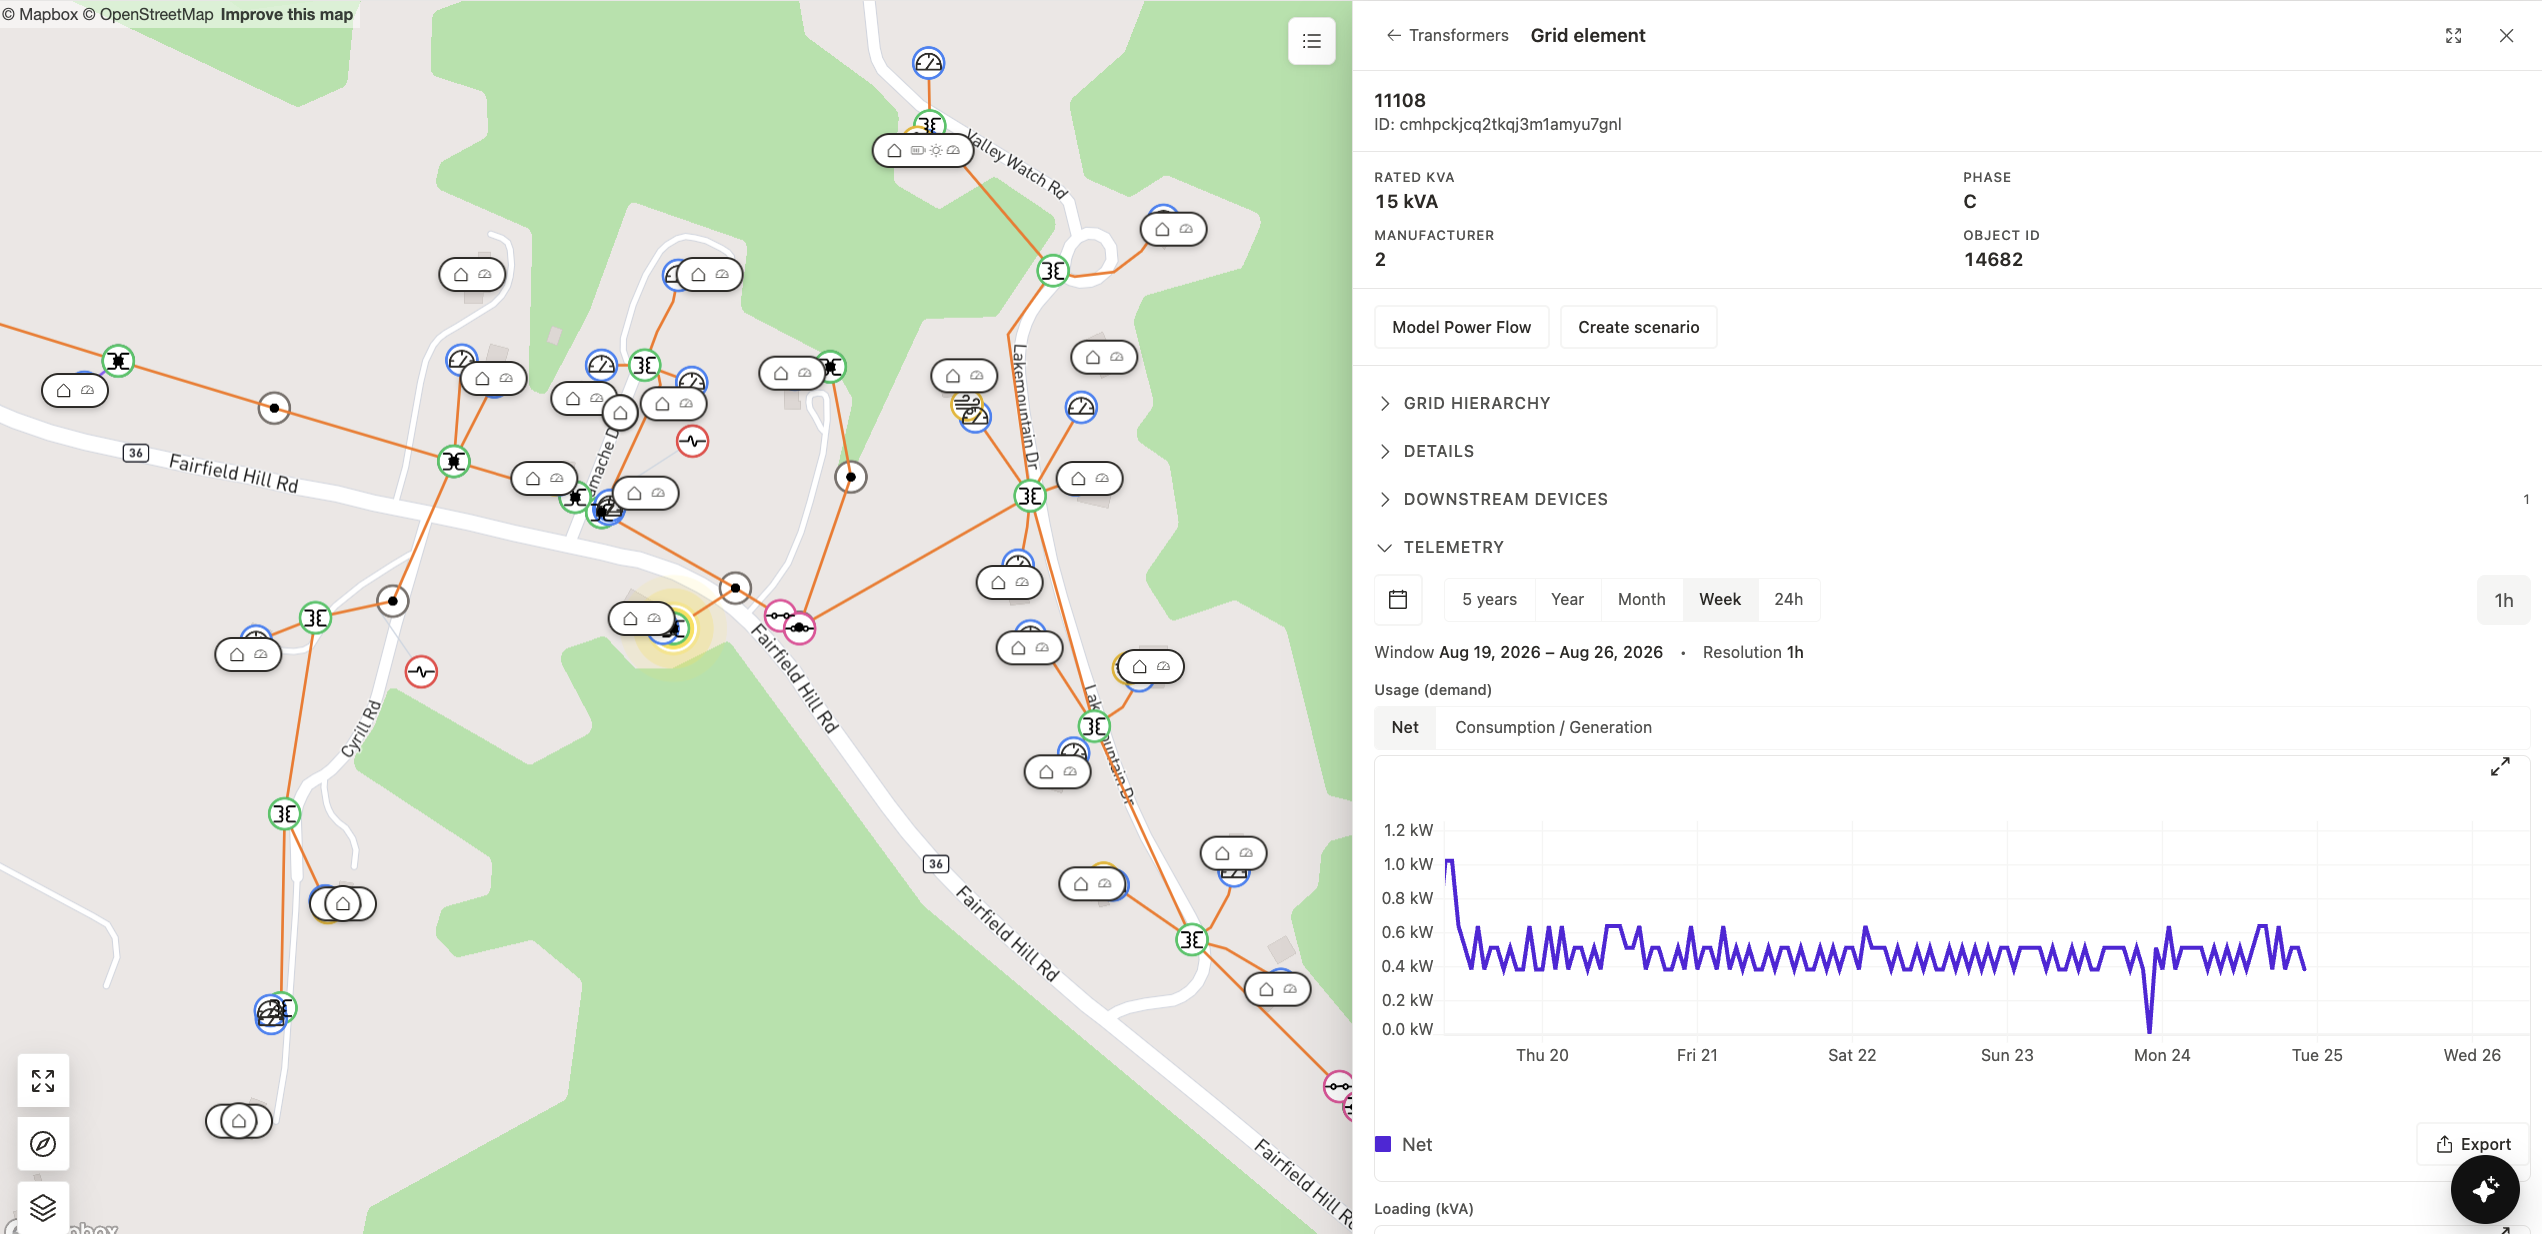
Search or select a transformer. Find it by name/ID, or click it directly on the map.
Review the load chart. The detail view plots aggregated load (kVA) over time, with the transformer's nameplate rating shown as a dotted threshold line — so you can see at a glance whenever load crosses it.
Review your whole fleet in the table view
Go to the transformers list. From Explore, find Transformers in the Overview tab and open the table view instead of the map.
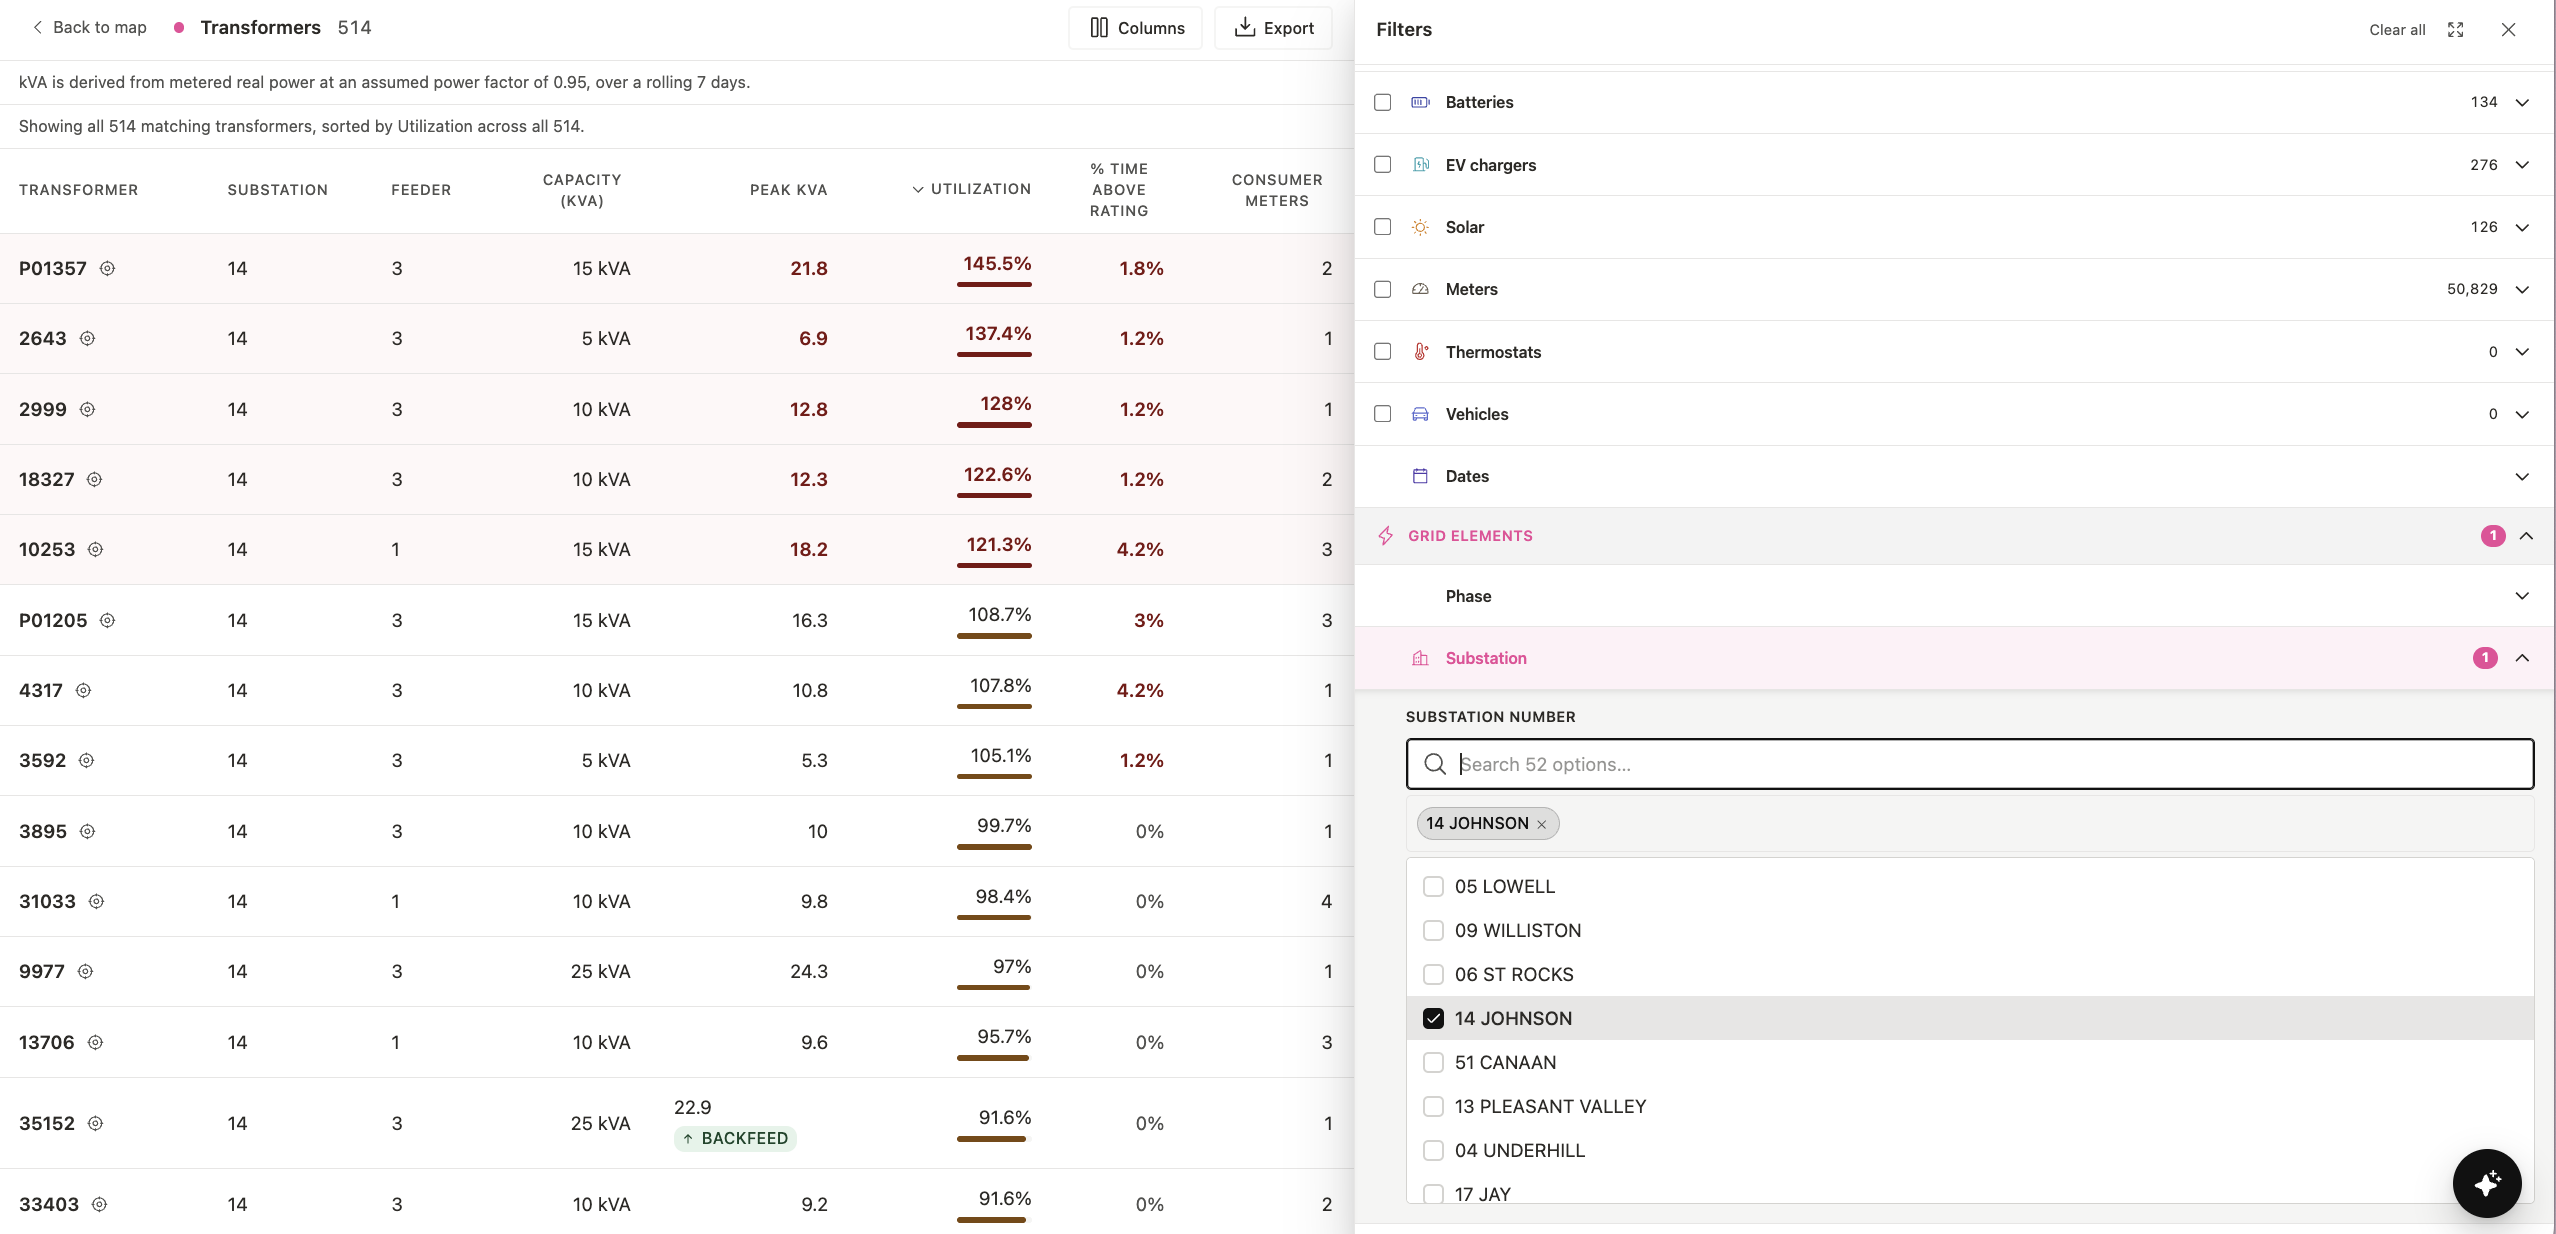
Add the utilization columns you want. The table can show peak kVA, peak export kVA, utilization %, and % time above rating for every transformer in the list.
Sort by any column. Click a column header — for example, sort by Utilization % to bring your most heavily loaded transformers to the top.
Check the reporting window. The window the numbers cover (for example, a rolling multi-day period) is shown at the top of the table.
Filter down to a substation
Open the substation filter. Above the table, use the search-and-select filter for substations.
Search and add one or more substations. Type to search by name; select as many as you want to include.
Re-sort within the filtered set. Sorting still works on the narrowed list — useful for finding the top utilizers within just that substation.
Remove a substation or clear the filter. Click the chip to remove one substation, or clear the search bar to return to the full fleet.
Good to know
Flags point at the data, not necessarily the asset. A utilization or back-feed annotation usually means the nameplate rating (or another input) needs a second look, not always that the transformer is failing.
NOTE Transformer loading depends on grid topology (to connect meters to transformers) and nameplate ratings being populated. If either is missing for a transformer, you may see load trends but no utilization value. |
Related articles
Transformer Loading — how utilization is calculated and what drives it.
Grid Topology & GIS — where meter-to-transformer matching and nameplate ratings come from.
Meters — the interval data transformer loading aggregates.